Eaton Vance Investments (now a part of Morgan Stanley)
Sherpa
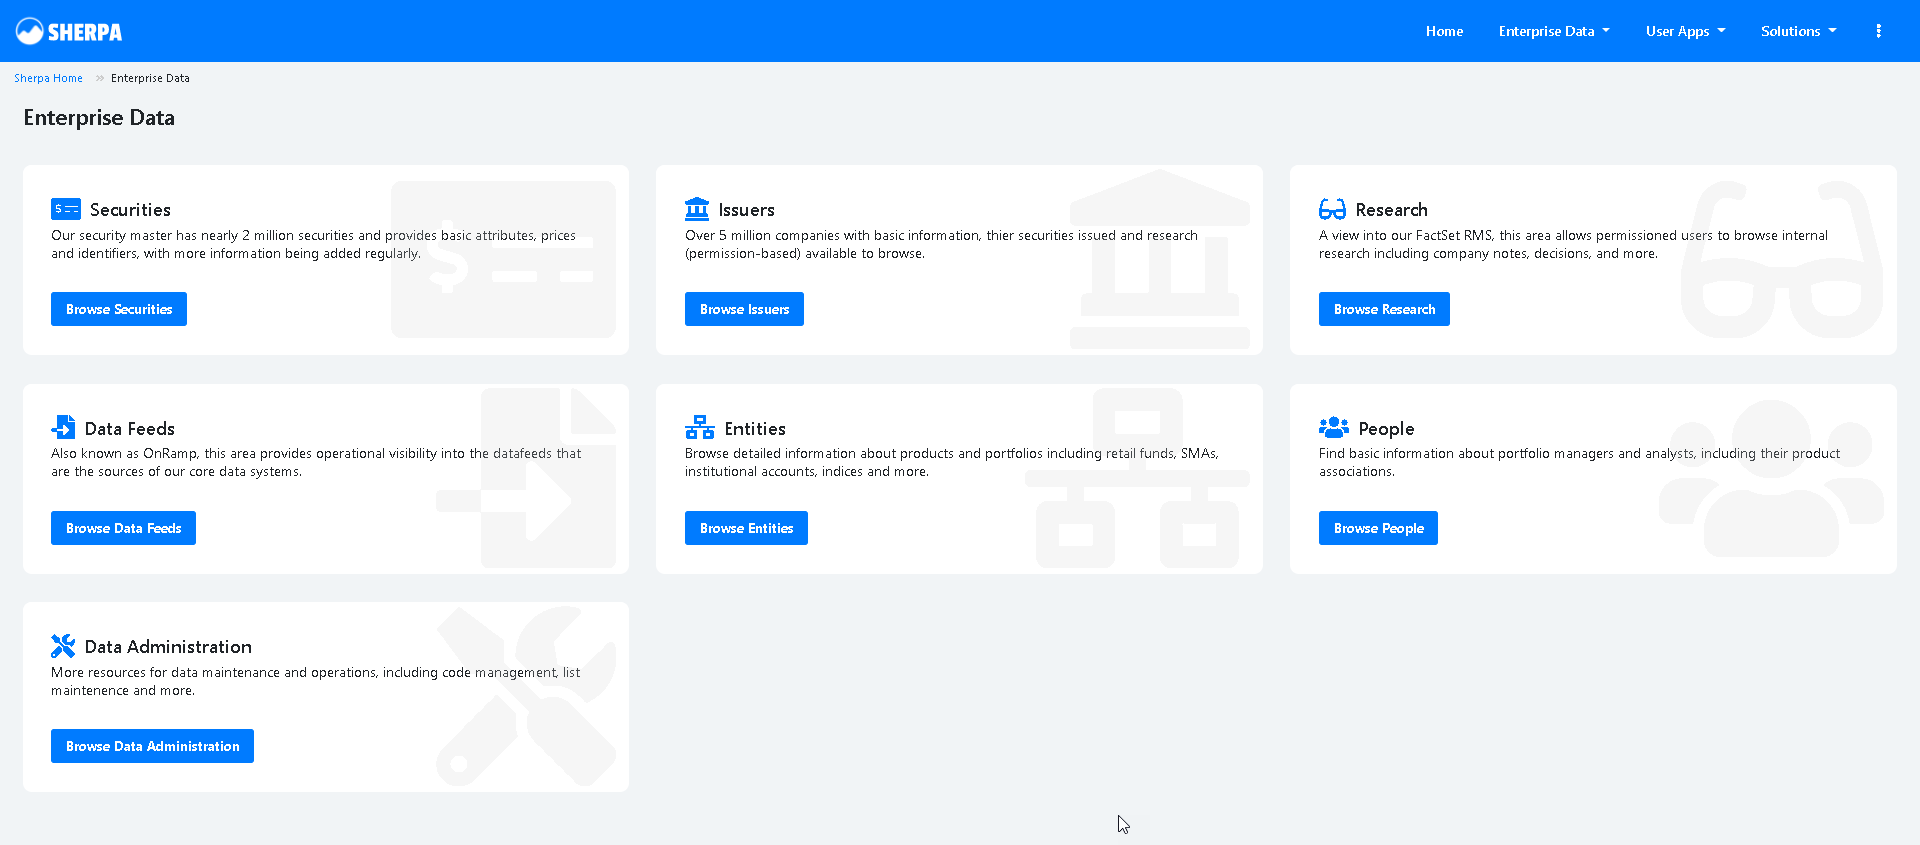
Sherpa provides businesses with peace of mind by consolidating critical data from multiple sources into one accessible location. Users can log in to their dashboard and access data through a user-friendly browser interface, ensuring seamless interaction and efficient data management. The customizable apps enable querying multiple databases or a single database, providing stakeholders with the flexibility they need.
After analyzing the original Sherpa interface by observing user interactions through Matomo and conducting interviews with users, I helped identify several key problem areas:
Customization and Reusability: There was a need for reusable components that allowed users the freedom to customize their dashboards. Users also expressed the need to save their searches directly from their dashboards for quick and simple access in the future.
Readability Issues: The numbers on the dashboard were small and difficult to read, especially on the go. Users mentioned preferring larger, more legible numbers for easier readability, particularly in mobile and outdoor environments.
Lack of responsive design: Users had to scroll sideways with no indication that scrolling was necessary. Mobile devices often obscured critical data points, such as securities and performance metrics, from immediate view.
Unintuitive UI: The user interface was difficult to navigate and visually unappealing. Users found it difficult to locate important features, and the overall design did not provide a pleasant user experience.
After identifying these issues, I worked directly with our UX designer to create new designs that alleviate the user problem areas. Additionally, I gathered a requirements document and created Jira stories for our engineers to implement the new designs into the interface. This structured approach helped guide the redesign process, ensuring a more intuitive and efficient user experience.


Leveraging Matomo for User Insights on Sherpa
To gain deeper insights into user behavior, I utilized Matomo, an advanced analytics platform. Matomo provided detailed reports on user interactions, allowing me to track navigation patterns, identify bottlenecks, and understand how users engaged with different features of Sherpa. This data was instrumental in pinpointing the areas that required improvement.


Implementing Reusable Components with CRUD Options
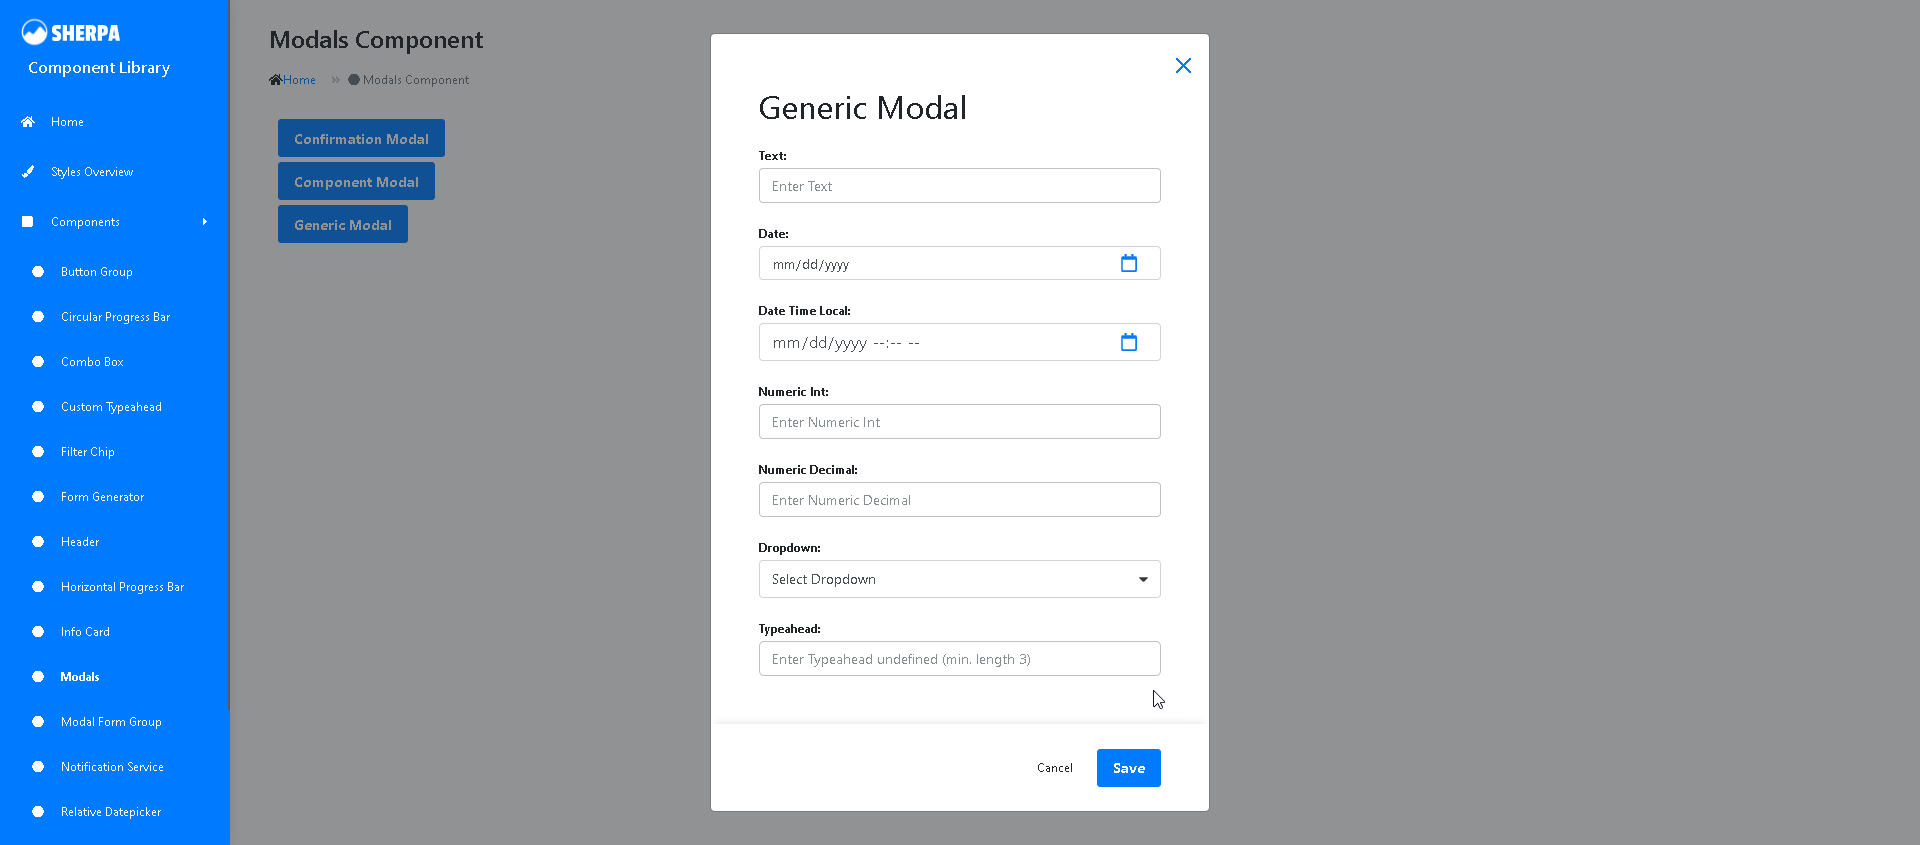
I worked with our UX Designer to create reusable components that allowed users to easily customize their dashboards and perform CRUD (Create, Read, Update, Delete) operations as part of enhancing Sherpa's usability.
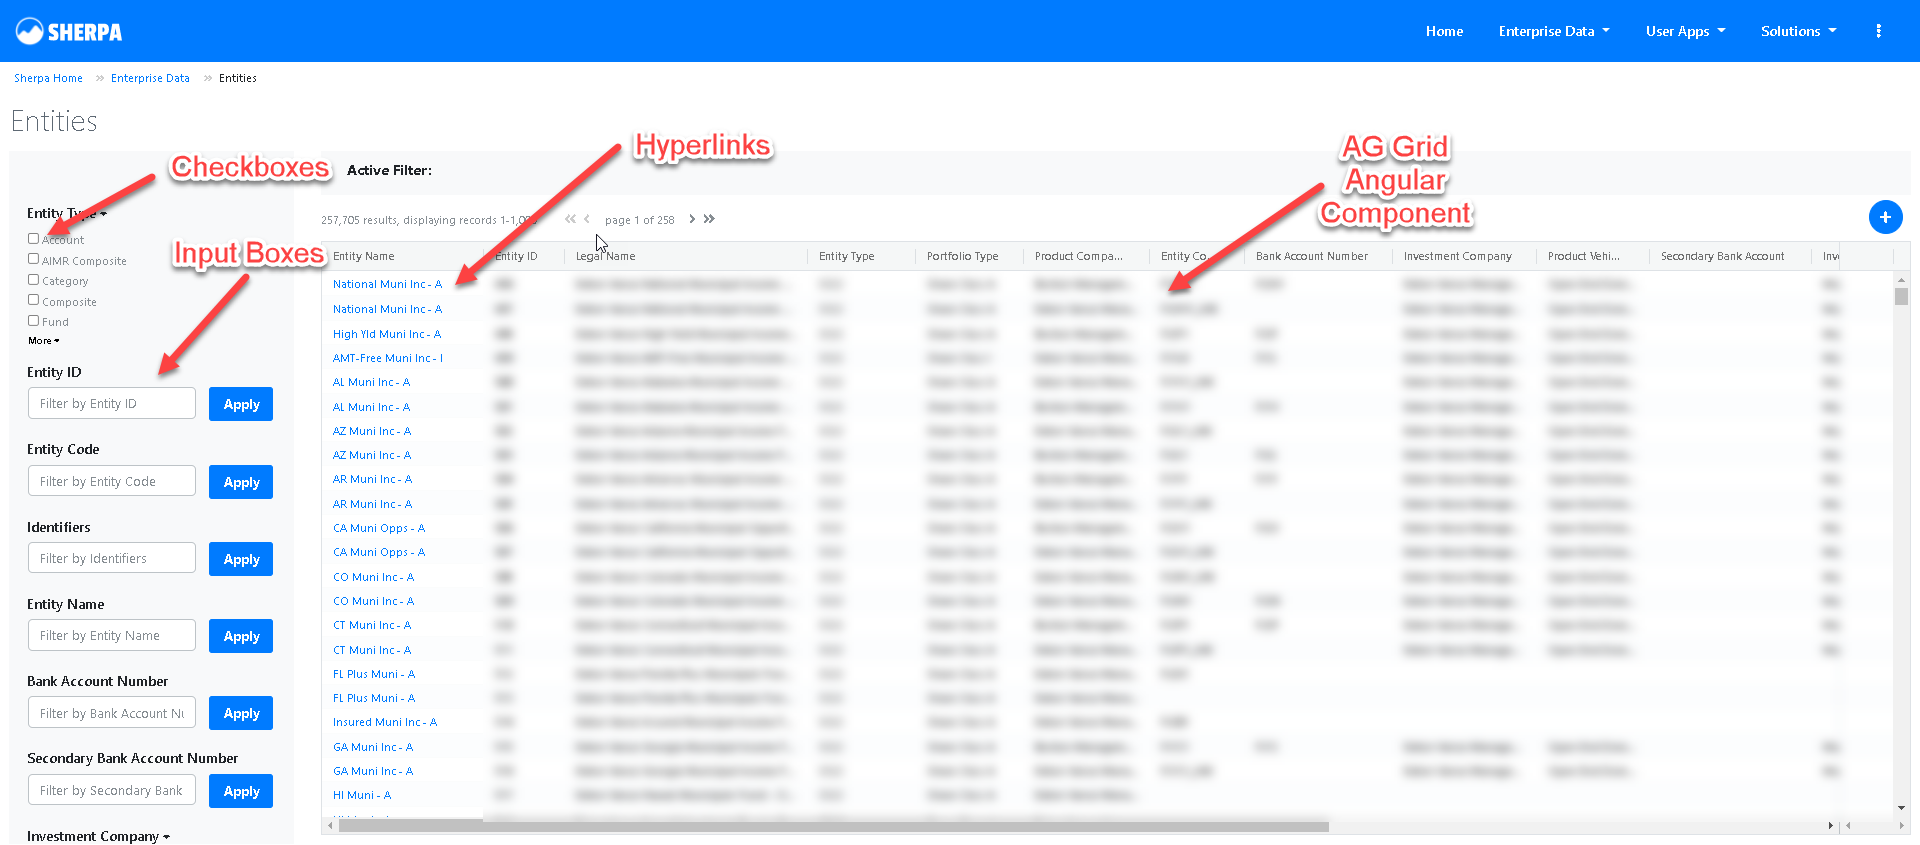
To achieve this, we implemented a variety of interactive and user-friendly elements:
Checkboxes: For selecting multiple items quickly and easily.
Identifiable Icons: To enhance visual navigation and identify different actions or data types.
Add Button: Allows users to add new data or components to their dashboards.
Reorder Buttons: Allowing users to arrange their dashboard elements according to their preferences.
Grid Components: For organizing data in a structured and readable format.
Hyperlinks: Facilitating quick access to related information and external resources.
Input boxes provide fields for users to enter and update data.
AG Grid Angular Components: For advanced data grid functionalities, including sorting, filtering, and pagination.
Saved Searches: Allowing users to save their search queries directly from their dashboards for quick access in the future.
We designed these components to be highly customizable, allowing users to customize their dashboards to meet their specific needs. By focusing on reusability and ease of use, I ensured that Sherpa's interface not only met the diverse requirements of its users, but also provided a more intuitive and efficient user experience.